Every account tells a story.
Most traders never read theirs.
Scroll down and we'll walk you through it, from your first import to a stats page you can share.
It starts with one file
Not with a blank spreadsheet and good intentions. You export a statement from your broker, drop it here, and we do the rest: trades, positions, fees, dividends, even the small details.
- Multiple brokers supported
- Automatic sync is available too
- Prefer typing? Manual entry works too
- Re-import anytime, duplicates are detected automatically
Now you can see the whole run
Account value, deposits, P&L, win rate, profit factor, best and worst trade, average hold time, total fees, and more. One screen, zero formulas.
- Realized and unrealized P&L, separated
- 3D / 1W / 1M / 6M / YTD / 5Y ranges
- Last trades with live prices
- Insights: best day, hot streaks, fee drag, top performer, and more, generated for you
This part hurts. Look at it anyway.
The curve just went red, and so does every account sometimes. The P&L calendar shows exactly where: which days bleed, which weekday you overtrade, what a losing streak actually looks like and why it happened.
- Red days you keep repeating
- The Monday you should stop trading
- Streaks, visible before they get expensive
Every trade, from every angle
Every trade lands in the Report: filterable by symbol, tag, side, session, hold time, even asset class. Daily P&L, monthly performance, top performers, size vs. result, hold-time buckets - the numbers you'd otherwise have to build yourself in a spreadsheet.
- Every closed and open trade, filterable
- Daily and monthly breakdowns, top performers, and plenty more
- Nothing to build, nothing to maintain
Prove it. Without doxxing your account.
New equity high, and now someone in the group chat wants receipts. Your public page is built from imported broker data, not a cropped screenshot. You choose what's visible: account size / percentages, portfolio, or everything.
- Your own link: pnl.trading/u/yourname
- Hide sensitive numbers with a toggle
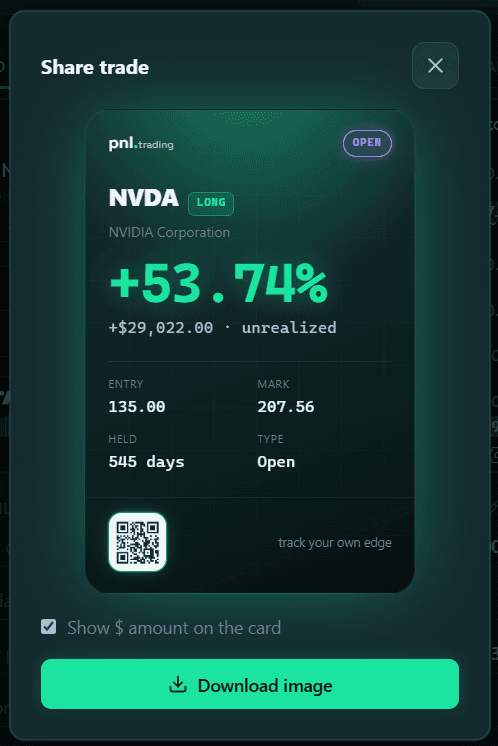
- Share individual trade P&L cards too